-
DISTANCE-TIME GRAPHS
DISTANCE-TIME GRAPHS
Graphs provide a convenient method to present basic information about a variety of events. For example, in the telecast of a one-day cricket match, vertical bar graphs show the run rate of a team in each over. As you have studied in mathematics, a straight line graph helps in solving a linear equation having two variables.
To describe the motion of an object, we can use line graphs. In this case, line graphs show dependence of one physical quantity, such as distance or velocity, on another quantity, such as time.
The change in the position of an object with time can be represented on the distance-time graph adopting a convenient scale of choice. In this graph, time is taken along the x–axis and distance is taken along the y-axis. Distance - time graphs can be employed under various conditions where objects move with uniform speed, non-uniform speed, remain at rest etc.
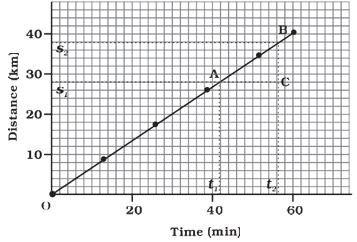
Figure 8.3: Distance-time graph of an object moving with uniform speed
We know that when an object travels equal distances in equal intervals of time, it moves with uniform speed. This shows that the distance travelled by the object is directly proportional to time taken. Thus, for uniform speed, a graph of distance travelled against time is a straight line, as shown in Fig. 8.3. The portion OB of the graph shows that the distance is increasing at a uniform rate. Note that, you can also use the term uniform velocity in place of uniform speed if you take the magnitude of displacement equal to the distance travelled by the object along the y-axis.
We can use the distance-time graph to determine the speed of an object. To do so, consider a small part AB of the distance-time graph shown in Fig 8.3. Draw a line parallel to the x-axis from point A and another line parallel to the y-axis from point B. These two lines meet each other at point C to form a triangle ABC. Now, on the graph, AC denotes the time interval (t2 – t1) while BC corresponds to the distance (s2 – s1). We can see from the graph that as the object moves from the point A to B, it covers a distance (s2 – s1) in time (t2 – t1). The speed, v of the object, therefore can be represented as
v = \(\frac {s_2-s_1 }{t_2-t_1}\) ______(8.4)
We can also plot the distance-time graph for accelerated motion. Table 8.2 shows the distance travelled by a car in a time interval of two seconds.
Time in seconds
Distance in metres
0
0
2
1
4
4
6
9
8
16
10
25
12
36
Table 8.2: Distance travelled by a car at regular time intervals
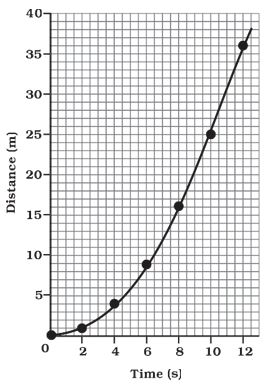
Figure 8.4: Distance-time graph for a car moving with non-uniform speed
The distance-time graph for the motion of the car is shown in Fig. 8.4. Note that the shape of this graph is different from the earlier distance-time graph (Fig. 8.3) for uniform motion. The nature of this graph shows non- linear variation of the distance travelled by the car with time. Thus, the graph shown in Fig 8.4 represents motion with non-uniform speed.
Questions
1. What is the nature of the distance-time graphs for uniform and non-uniform motion of an object?
2. What can you say about the motion of an object whose distance-time graph is a straight line parallel to the time axis?
Source: This topic is taken from NCERT TEXTBOOK
-
VELOCITY-TIME GRAPHS
VELOCITY-TIME GRAPHS
Velocity-Time graph for object moving with uniform velocityThe variation in velocity with time for an object moving in a straight line can be represented by a velocity-time graph. In this graph, time is represented along the x-axis and the velocity is represented along the y-axis. If the object moves at uniform velocity, the height of its velocity-time graph will not change with time (Fig. 8.5). It will be a straight line parallel to the x-axis. Fig. 8.5 shows the velocity-time graph for a car moving with a uniform velocity of 40 kmh–1.
We know that the product of velocity and time gives a displacement of an object moving with uniform velocity. The area enclosed by velocity-time graph and the time axis will be equal to the magnitude of the displacement.
To know the distance moved by car between time t1 and t2 using Fig. 8.5, draw perpendiculars from the points corresponding to the time t1 and t2 on the graph. The velocity of 40 kmh–1 is represented by the height AC or BD and the time (t2 – t1) is represented by the length AB.
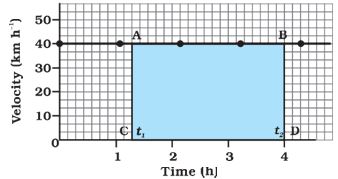
Figure 8.5: Velocity-time graph for uniform motion of a car
So, the distance s moved by the car in time (t2– t1) can be expressed as
s = AC × CD
= [(40 km h–1)\(\times\) (t2– t1) h]
= 40 (t2– t1) km
= area of the rectangle ABDC (shaded in Fig. 8.5)
Velocity-Time graph in uniformly accelerated motion
We can also study the uniformly accelerated motion by plotting its velocity-time graph. Consider a car being driven along a straight road for testing its engine. Suppose a person sitting next to the driver records its velocity after every 5 seconds by noting the reading of the speedometer of the car. The velocity of the car, in kmh–1 as well as in ms–1, at different instants of time is shown in table 8.3.
Time (s)
Velocity of the car
(ms–1) (kmh )–1
0
0
0
5
2.5
9
10
5.0
18
15
7.5
27
20
10.0
36
25
12.5
45
30
15.0
54
Table 8.3: Velocity of a car at regular instants of time
In this case, the velocity-time graph for the motion of the car is shown in Fig. 8.6. The nature of the graph shows that velocity changes by equal amounts in equal intervals of time. Thus, for all uniformly accelerated motion, the velocity-time graph is a straight line.

Figure 8.6: Velocity-time graph for a car moving with uniform accelerations.
You can also determine the distance moved by the car from its velocity-time graph. The area under the velocity-time graph gives the distance (magnitude of displacement) moved by car in a given interval of time. If the car would have been moving with uniform velocity, the distance travelled by it would be represented by the area ABCD under the graph (Fig. 8.6). Since the magnitude of the velocity of the car is changing due to acceleration, the distance s travelled by car will be given by the area ABCDE under the velocity-time graph (Fig. 8.6).
That is,
s = area ABCDE
= area of the rectangle ABCD + area of the triangle ADE
= \(AB\times BC+\frac{1}{2}(AB\times BC)\)
Velocity-Time graph in non-uniformly accelerated motion
In the case of non-uniformly accelerated motion, velocity-time graphs can have any shape.
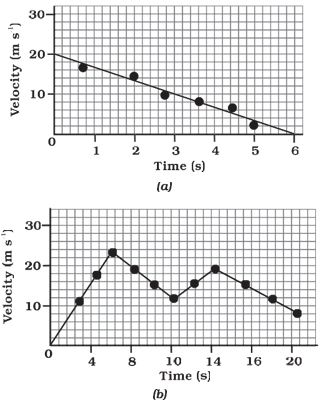
Figure 8.7: Velocity-time graphs of an object in non-uniformly accelerated motion
Fig. 8.7(a) shows a velocity-time graph that represents the motion of an object whose velocity is decreasing with time while Fig. 8.7 (b) shows the velocity-time graph representing the non-uniform variation of velocity of the object with time. Try to interpret these graphs.
Activity 8.9:
* The times of arrival and departure of a train at three stations A, B and C and the distance of stations B and C from station A are given in table 8.4
Station
Distance
Time of
Time of
from A
(km)
arrival
(hours)
departure
(hours)
A
0
08:00
08:15
B
120
11:15
11:30
C
180
13:00
13:15
Table 8.4: Distances of stations B and C from A and times of arrival and departure of the train.
* Plot and interpret the distance-time graph for the train assuming that its motion between any two stations is uniform.
Activity 8.10:
* Feroz and his sister Sania go to school on their bicycles. Both of them start at the same time from their home but take different times to reach the school although they follow the same route. Table 8.5 shows the distance travelled by them in different times.
Time
Distance travelled by
Feroz (km)
Distance travelled by
Sania (km)
8:00 am
0
0
8:05 am
1.0
0.8
8:10 am
1.9
1.6
8:15 am
2.8
2.3
8:20 am
3.6
3.0
8:25 am
-
3.6
Table 8.5: Distance covered by Feroz and Sania at different times on their bicycles.
* Plot the distance-time graph for their motions on the same scale and interpret.
Questions
1. What can you say about the motion of an object if its speed time graph is a straight line parallel to the time axis?
2. What is the quantity which is measured by the area occupied below the velocity-time graph?
Source: This topic is taken from NCERT TEXTBOOK