-
HOW TO COMPARE DIFFERENT COUNTRIES AND STATES?
HOW TO COMPARE DIFFERENT COUNTRIES AND STATES?
You might ask if development can mean different things, how come some countries are generally called developed and others underdeveloped? Before we come to this, let us consider another question.
When we compare different things, they could have similarities as well as differences. Which aspects do we use to compare them? Let us look at students in the class itself. How do we compare different students? They differ in their height, health, talents and interests. The healthiest student may not be the most studious one. The most intelligent student may not be the friendliest one. So, how do we compare students? The criterion we may use depends on the purpose of comparison. We use different criteria to choose a sports team, a debate team, a music team or a team to organise a picnic. Still, if for some purpose, we have to choose the criterion for the all-round progress of children in the class, how shall we do it?
Usually, we take one or more important characteristics of persons and compare them based on these characteristics. Of course, there can be differences about what are important characteristics that should form the basis of comparison: friendliness and spirit of cooperation, creativity or marks secured?
This is true of development too. For comparing countries, their income is considered to be one of the most important attributes. Countries with higher income are more developed than others with less income. This is based on the understanding that more income means more of all things that human beings need. Whatever people like, and should have, they will be able to get with greater income. So, the greater income itself is considered to be one important goal.
Now, what is the income of a country? Intuitively, the income of the country is the income of all the residents of the country. This gives us the total income of the country.
However, for comparison between countries, total income is not such a useful measure. Since, countries have different populations, comparing total income will not tell us what an average person is likely to earn. Are people in one country better off than others in a different country? Hence, we compare the average income which is the total income of the country divided by its total population. The average income is also called per capita income.
In World Development Reports, brought out by the World Bank, this criterion is used in classifying countries. Countries with per capita income of US$ 12,056 per annum and above in 2017, are called rich countries and those with per capita income of US$ 955 or less are called low-income countries. India comes in the category of low middle-income countries because its per capita income in 2017 was just US$ 1820 per annum. The rich countries, excluding countries of Middle East and certain other small countries, are generally called developed countries.
Source: This topic is taken from NCERT TEXTBOOK
-
AVERAGE INCOME
AVERAGE INCOME
While ‘averages’ are useful for comparison, they also hide disparities.
For example, let us consider two countries, A and B. For the sake of simplicity, we have assumed that they have only five citizens each. Based on data given in Table 1.2, calculate the average income for both countries.
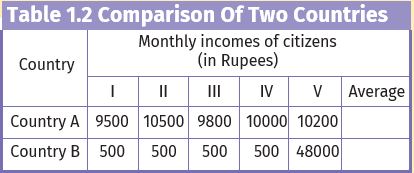
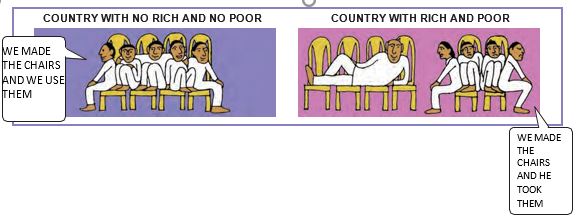
Will you be equally happy to live in both these countries? Are both equally developed? Perhaps some of us may like to live in country B if we are assured of being its fifth citizen but if it is a lottery that decides our citizenship number then perhaps most of us will prefer to live in country A. Even though both countries have an identical average income, country A is preferred because it has a more equitable distribution. In this country, people are neither very rich nor extremely poor. On the other hand, most citizens in country B are poor and one person is extremely rich. Hence, while the average income is useful for comparison it does not tell us how this income is distributed among people.
Let’s work these out
1. Give three examples where an average is used for comparing situations.
2. Why do you think average income is an important criterion for development? Explain.
3. Besides the size of per capita income, what other property of income is important in comparing two or more societies?
4. Suppose records show that the average income in a country has been increasing over a period of time. From this, can we conclude that all sections of the economy have become better? Illustrate your answer with an example.
5. From the text, find out the per capita income level of low-income countries as per World Development Reports.
6. Write a paragraph on your notion of what should India do, or achieve, to become a developed country.
Source: This topic is taken from NCERT TEXTBOOK
-
INCOME AND OTHER CRITERIA
INCOME AND OTHER CRITERIA
When we looked at individual aspirations and goals, we found that people not only think of better income but also have goals such as security, respect for others, equal treatment, freedom, etc. in mind. Similarly, when we think of a nation or a region, we may, besides average income, think of other equally important attributes.
What could these attributes be? Let us examine this through an example. Table 1.3 gives the per capita income of Haryana, Kerala, and Bihar. Actually, these figures are of Per Capita Net State Domestic Product at Current Prices for 2016–17. Let us ignore what this complicated term exactly means. Roughly, we can take it to be the per capita income of the state. We find that of the three, Haryana has the highest per capita income and Bihar is at the bottom. This means that, on average, a person in Haryana earned Rs 1,80,174 in one year whereas, on average, a person in Bihar earned only around Rs 34,409. So, if per capita income were to be used as the measure of development, Haryana will be considered the most developed and Bihar the least developed state of the three.
State Per Capita Income for 2015-16 (in Rs) Haryana 1,80,174 Kerala 1,63,475 Bihar 34,409 Table 1.3: Per capita income of select states
Now, let us look at certain other data pertaining to these states given in Table 1.4.
State Infant Mortality Rate per 1,000 live births (2017) Literacy Rate % Net Attendance Ratio (per 100 persons) secondary stage (age 14 and 15 years) 2013-14 2011 Haryana 30 82 61 Kerala 10 94 83 Bihar 35 62 43 Table 1.4: some comparative data on Haryana, Kerala and Bihar
Explanation of some of the terms used in this table
Infant Mortality Rate (or IMR) indicates the number of children that die before the age of one year as a proportion of 1000 live children born in that particular year.
Literacy Rate measures the proportion of the literate population in the 7-and-above age group.
Net Attendance Ratio is the total number of children of age group 14 and 15 years attending school as a percentage of the total number of children in the same age group.
What does this table show? The first column of the table shows that in Kerala, out of 1000 children born, 10 died before completing one year of age but in Haryana, the proportion of children dying within one year of birth was 30, which is two times more than that of Kerala. On the other hand, the per capita income of Haryana is more than that of Kerala as shown in Table 1.3. Just think of how dear you are to your parents, think of how everyone is so happy when a child is born. Now, try to think of parents whose children die before they even celebrate their first birthday. How painful it must be to these parents? Next, note the year to which this data pertains. It is 2017. So we are not talking of old times; it is 70 years after independence when our metro cities are full of high-rise buildings and shopping malls!
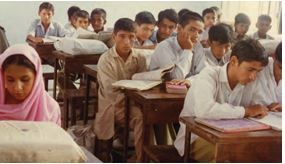
The problem does not end with Infant Mortality Rate. The last column of Table 1.4 shows around half of the children aged 14-15 in Bihar are not attending school beyond Class 8. This means that if you went to school in Bihar nearly half of your elementary class would be missing. Those who could have been in school are not there! If this had happened to you, you would not be able to read what you are reading now

Most babies do not get basic healthcare
Source: This topic is taken from NCERT TEXTBOOK
-
PUBLIC FACILITIES
PUBLIC FACILITIES
How is it that the average person in Haryana has more income than the average person in Kerala but lags behind in these crucial areas? The reason is — money in your pocket cannot buy all the goods and services that you may need to live well. So, income by itself is not a completely adequate indicator of material goods and services that citizens are able to use. For example, normally, your money cannot buy you a pollution-free environment or ensure that you get unadulterated medicines unless you can afford to shift to a community that already has all these things. Money may also not be able to protect you from infectious diseases unless the whole of your community takes preventive steps.
Actually for many of the important things in life the best way, also the cheapest way, is to provide these goods and services collectively. Just think – will it be cheaper to have collective security for the whole locality or for each house to have its own security man? What if no one, other than you, in your village or locality is interested in studying? Would you be able to study? Not unless your parents could afford to send you to some private school elsewhere. So you are actually able to study because many other children also want to study and because many people believe that the government should open schools and provide other facilities so that all children have a chance to study. Even now, in many areas, children, particularly girls, are not able to go to high school because the government/ society has not provided adequate facilities.
Kerala has a low Infant Mortality Rate because it has adequate provision of basic health and educational facilities. Similarly, in some states, the Public Distribution System (PDS) functions well. Health and nutritional status of people of such states is certainly likely to be better.

Activity:
Study Table 1.5 carefully and fill in the blanks in the following paragraphs. For this, you may need to make calculations based on the table
Category Male Female Literacy rate for the rural population 76% 54% Literacy rate for rural children in the age group 10-14 years 90% 87% Percentage of rural children aged 10-14 attending school 85% 82% Table 1.5: Educational achievement of the rural population of Uttar Pradesh
(a) The literacy rate for all age groups, including young and old, is _______ for rural males and _______ for rural females. However, it is not just that these many
adults could not attend school but that there are ______ who are currently not in school.
(b) It is clear from the table that _______ % of rural girls and _______ % of rural boys are not attending school. Therefore, illiteracy among children in the age group 10- 14 is as high as % for rural females and % for rural males.
(c) This high level of illiteracy among _______ age group, even after more than 68 years of our independence, is most disturbing. In many other states also we are nowhere near realisation of the constitutional goal of free and compulsory education for all children up to the age of 14, which was expected to be achieved by 1960.
Let’s work these out
1. Look at data in Tables 1.3 and 1.4. Is Haryana ahead of Kerala in literacy rate etc., as it is in terms of per capita income?
State Per Capita Income for 2015-16 (in Rs) Haryana 1,80,174 Kerala 1,63,475 Bihar 34,409 Table 1.3: Per capita income of select states
State Infant Mortality Rate per 1,000 live births (2017) Literacy Rate % Net Attendance Ratio (per 100 persons) secondary stage (age 14 and 15 years) 2013-14 2011 Haryana 30 82 61 Kerala 10 94 83 Bihar 35 62 43 Table 1.4: some comparative data on Haryana, Kerala and Bihar
2. Think of other examples where the collective provision of goods and services is cheaper than individual provision.
3. Does the availability of good health and educational facilities depend only on the amount of money spent by the government on these facilities? What other factors could be relevant?
4. In Tamil Nadu, 90 percent of the people living in rural areas use a ration shop, whereas in West Bengal only 35 percent of rural people do so. Where would people be better off and why?
Source: This topic is taken from NCERT TEXTBOOK
-
HUMAN DEVELOPMENT REPORT
HUMAN DEVELOPMENT REPORT
Once it is realised that even though the level of income is important, yet it is an inadequate measure of the level of development, we begin to think of other criteria. There could be a long list of such criteria but then it would not be so useful. What we need is a small number of the most important things. Health and education indicators, such as the ones we used in the comparison of Kerala and Haryana, are among them. Over the past decade or so, health and education indicators have come to be widely used along with income as a measure of development. For instance, Human Development Report published by UNDP compares countries based on the educational levels of the people, their health status, and per capita income. It would be interesting to look at certain relevant data regarding India and its neighbours from Human Development Report 2019.
Country Gross National Income (GNI) per capita (2011 PPP $) Life Expectancy at birth (2017) Mean Years of Schooling of People aged 25
and above (2017)HDI Rank in the world (2018) Sri Lanka 11,326 75.5 10.9 76 India 6,353 68.8 6.4 130 Myanmar 5,567 66.7 4.9 148 Pakistan 5,331 66.6 5.2 150 Nepal 2,471 70.6 4.9 149 Bangladesh 3,677 72.8 5.8 136 Table 1.6: Some data regarding India and its neighbours for 2017
Notes:
1. HDI stands for Human Development Index. HDI ranks in the above table are out of 189 countries in all.
2. Life Expectancy at birth denotes, as the name suggests, the average expected length of life of a person at the time of birth.
3. Per Capita Income is calculated in dollars for all countries so that it can be compared. It is also done in a way so that every dollar would buy the same amount of goods and services in any country.
Isn’t it surprising that a small country in our neighbourhood, Sri Lanka, is much ahead of India in every respect and a big country like ours has such a low rank in the world? Table 1.6 also shows that though Nepal and Bangladesh have low per capita income than India, yet they are better than India in life expectancy.
Many improvements have been suggested in calculating HDI and many new components have been added to the Human Development Report but, by pre-fixing Human to Development, it has made it very clear that what is important in development is what is happening to citizens of a country. It is people, their health, their well being, that is most important.
Do you think there are certain other aspects that should be considered in measuring human development?
Body Mass Index (BMI).
One way to find out if we are properly nourished is to calculate what nutrition scientists call Body Mass Index (BMI). This is easy to calculate. Let each student in the class find out his or her weight and height. Take the weight of each student in kilograms (kg). Then, take the height by drawing up a scale on the wall and measuring accurately with the head straight. Convert the height recorded in centimeters into meters. Divide the weight in kg by the square of the height. The number you get is called BMI.
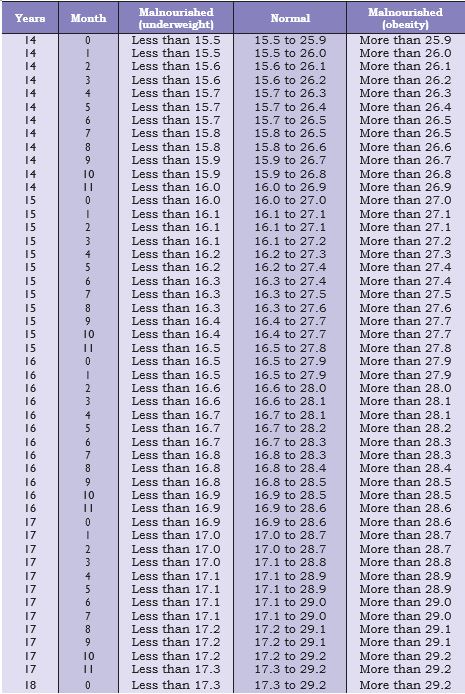
Body Mass Index for Adolescent Girls (Age 14-18)
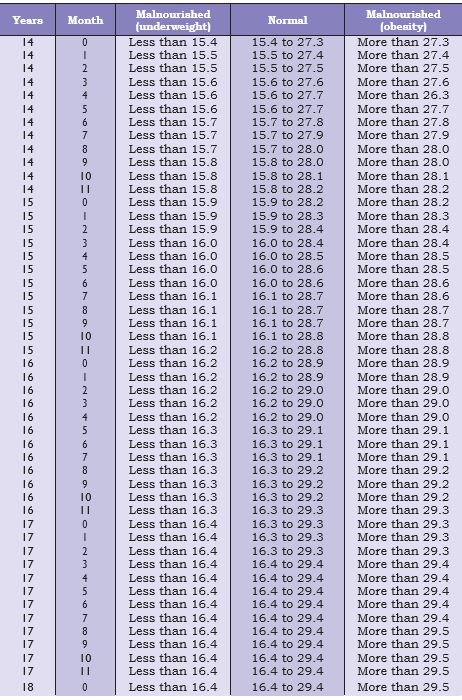
Body Mass Index for Adolescent Boys (Age 14-18)
Activity:
Then, look at the BMI-for-Age tables given above. A student’s BMI could be within the normal range or less than that (underweight) or more (obesity). For example, if a girl student is 14 years and 8 months old and the BMI is 15.2, then she is undernourished. Similarly, if the BMI of a boy aged 15 years and 6 months is 28, then he is overweight. Discuss the life situation, food and exercise habits of students, in general, without body shaming anyone.
Source: This topic is taken from NCERT TEXTBOOK