Class 4 / Mathematics Course Book 2 / Data Handling / Horizontal Bar Graph
-
Data Handling
We can also represent data on a horizontal bar graph.
The bar graph shows number of toys sold by a shopkeeper over four months
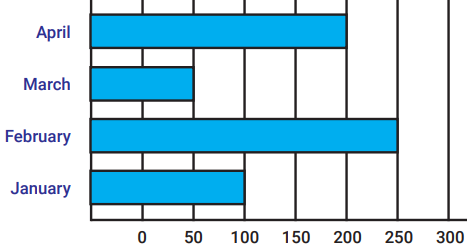
The number of toys sold every month can be read from graph.
January 100 February 250
March 50 April 200
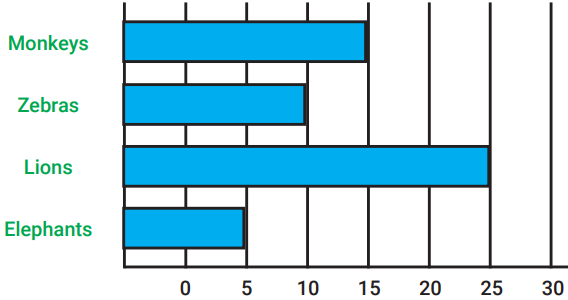
The bar graph shows different number of animals kept in a zoo