Class 4 / Mathematics Course Book 2 / Data Handling / Vertical Bar Graph
-
Data Handling
We can also show this data on a vertical bar graph.
A bar graph uses bars instead of pictures to show data.
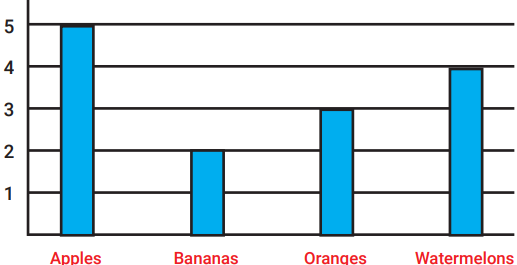
We can find out how many apples, bananas, oranges and watermelons Sara bought by reading the scale on the bar graph.
The bar at apples goes to 5, the bar at bananas goes to 2, the bar at oranges goes to 3 and the bar watermelons goes to 4.
Jack collected books on different subjects as shown in the table.
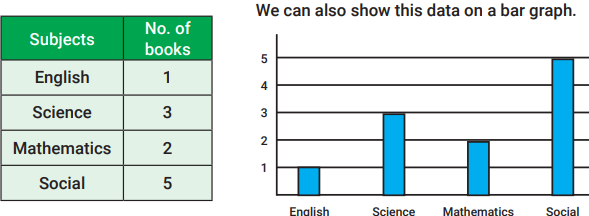
Read the scale and write the number of books Jack has.
English: The scale reads ____. Jack has ____ English book.
Science: The scale reads ____. Jack has ____ Science books.
Mathematics: The scale reads ____. Jack ____ Mathematics books.
Social: The scale reads ___. Jack has ____ Social books