-
Smart Charts
SMART CHARTS
How Many Hours?
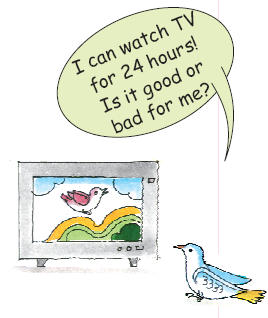
All of us enjoy watching television (TV) or listening to the radio.
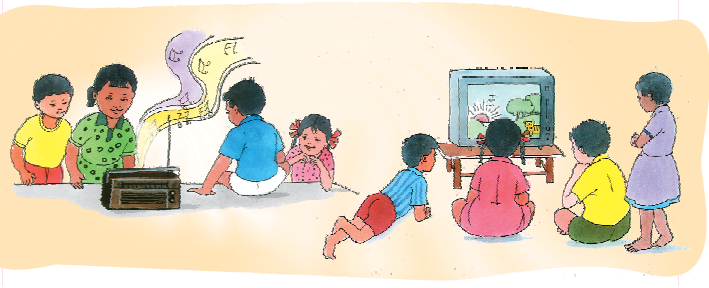
How much time do we spend in this?
- Note the time you spend in front of a TV or radio every day. Do this for one week. The time spent in a week is _________ hours.
So in a month you spend about 30 X ___ = _____ hours.
- Find out from your friends the time they spend in a week.
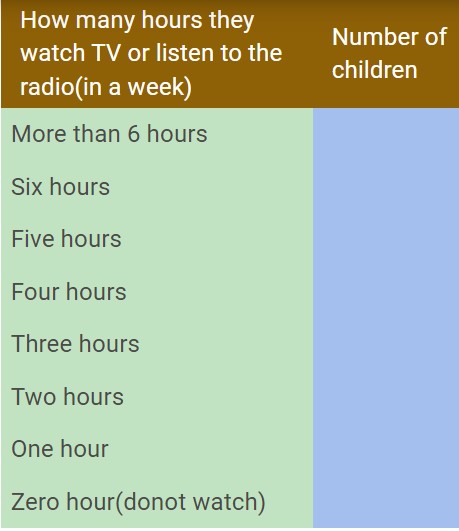 From your table
Watching TV/listening to the radio...
- ________ children spend more than 6 hours in a week.
- ________ children spend no time at all.
- Most children spend ________ hours in a week.
- ________ children spend more than 3 hours.
Which Programme?
There are different types of programmes on TV or radio such as cartoons, news, sports, music, plays, serials. Juhi's father likes watching serials. Her mother likes sports. Juhi likes news programmes.
- Ask people in your family to name one programme they like and one programme they dislike. Make a table.
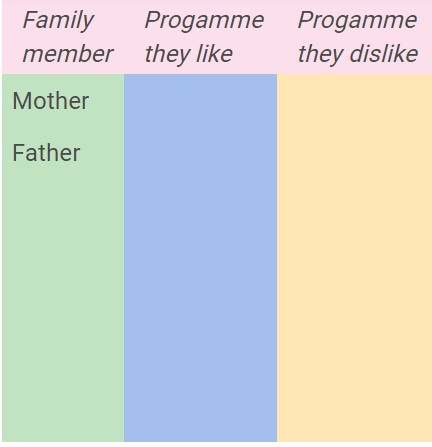 The kind of programme most family members like___________
The kind of programme most family members dislike _______
2. Find out from 20 friends the programmes they like and dislike, and write in a table.
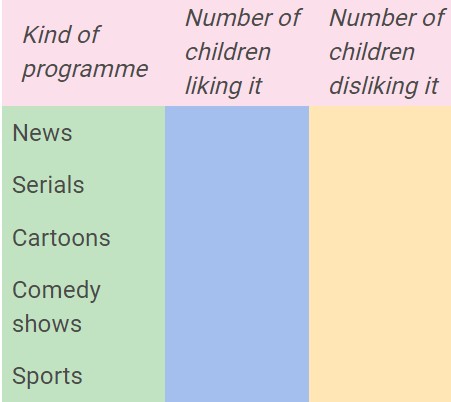
- Which kind of programme is liked by most children?
- Which kind of programme is disliked by the least number of children?
- How many children like sports programmes?
- Is there any kind of programme not liked by any one? Yes/No If yes, which one? ________________.
Who is my friend?
I've a friend with me always,
In the nights and through the days.
When I run he runs with me,
Sometimes I lead, sometimes he.
When it's dark he can't be seen,
Do you know which friend I mean?
- Read the poem carefully and answer these questions:
a) Which word comes most often in the poem?
b) Which letter has been used most?
c) Which letter comes the least?
- Take a paragraph you like from your language textbook. Read carefully and find out:
a) Which word comes most often? ________
How many times? ________
b) Which word comes least often? ________________
c) The letter used most often is ________________
d) The letter used least often is ________________
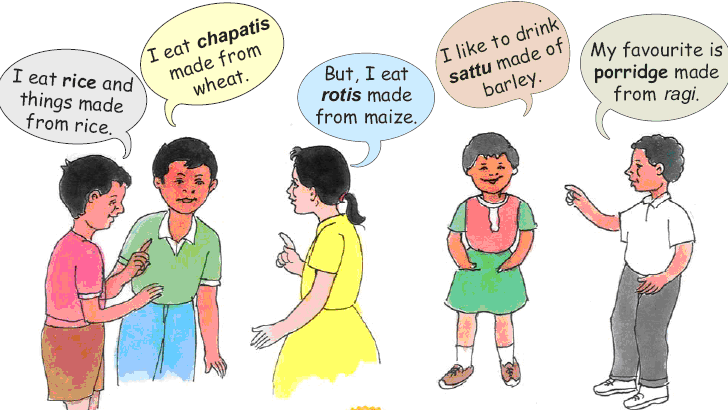
Food We Eat
Children were talking about what things they eat in the morning –made of rice, wheat, maize, barley, etc.
Find out from your classmates and fill the table:
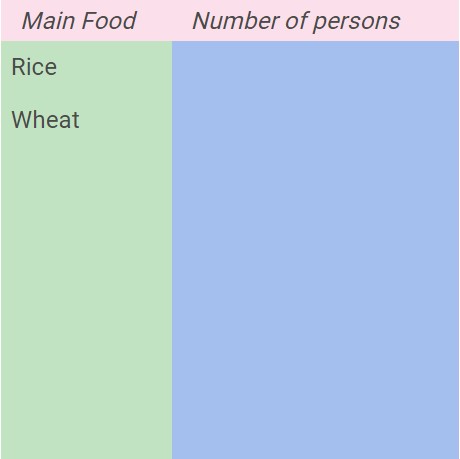
Look at the table and tell:
- Most children eat food made from _____________.
- Compared to children who eat rice, those who eat wheat are more/less/equal.
- Compared to those who eat wheat, children eating ragi are more/less.
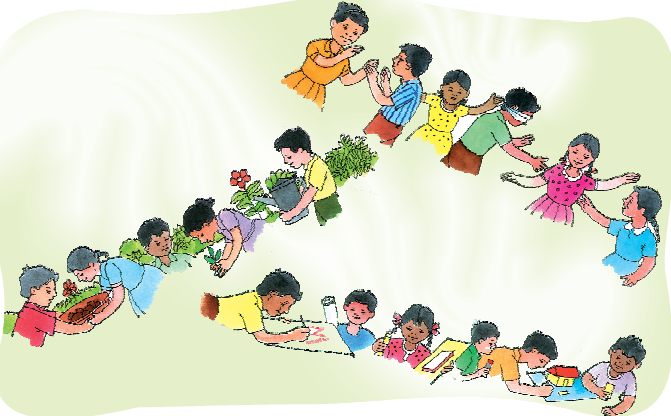
Preparing for the Class Drama
All children of a class are getting ready for a drama. Some children are acting. Some are busy collecting the dresses. Some are bringing tables and chairs to make the sets.
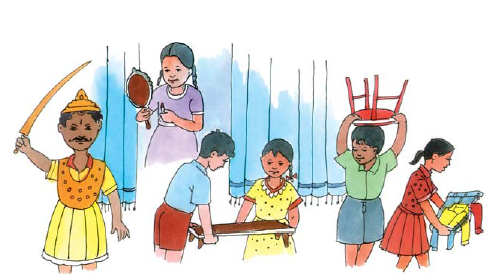
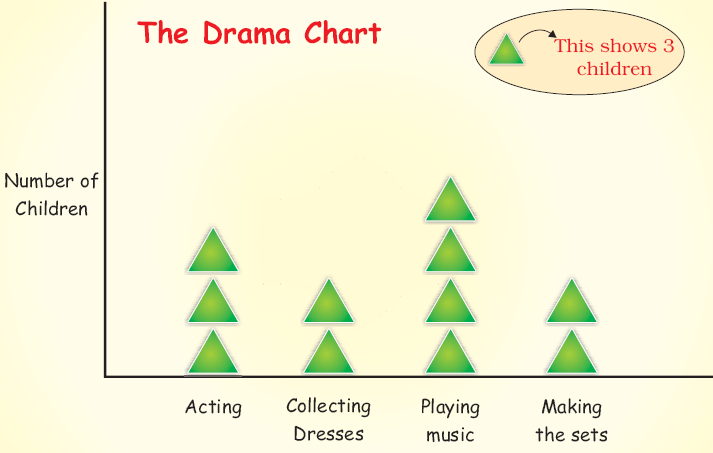
a) How many children are acting in the drama?
b) Which are more–children making the sets or those acting?
c) What is being done by most of the children?
d) How many children are collecting dresses?
Whose Head is Bigger?
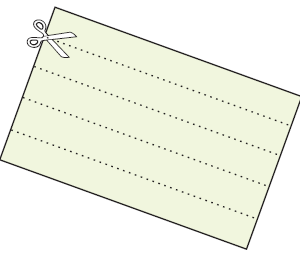
Cut long paper strips from waste paper.
Give one strip to each of your friends. Now put the paper strip around your head and tear off the extra strip. On a big sheet, paste these paper strips along a line.
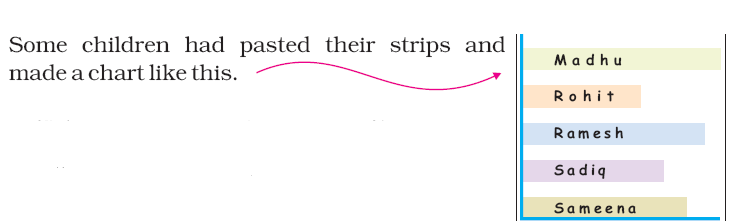
Your chart should also look like this.
- Use a scale and find out from your chart:
The length of the longest strip is _________ cm.
So ____________ has the biggest head.
The smallest strip is ___________ cm long. It belongs to __________.
Chapati Chart
All children of a school take part in different clubs:
The Chapati Chart shows the number of children in different clubs.
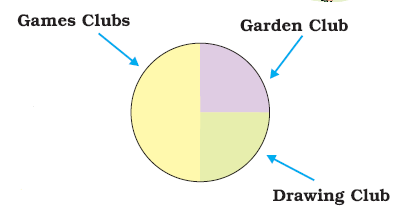
From the picture we can see that:
a) Half the children in the class take part in the Games Club.
b) One fourth of the children are members of the Garden Club.
c) The Drawing Club has one fourth of the children of the class.
If there are 200 students in the school, look at the above Chapati Chart and tell the number of members in each club:
- The Games Club has members.
- The Garden Club has members.
- There are members in the Drawing Club
Getting Wet in the Rain
Who likes to get wet in the rain? A child made this Chapati Chart after asking his friends.
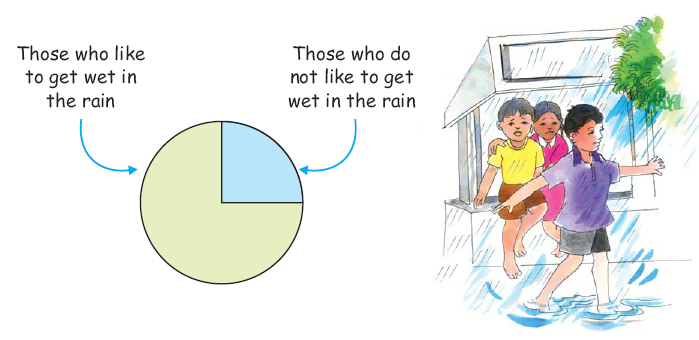
See the Chapati Chart and tell:
1. How many children like to get wet in the rain?
a) half
b) one-fourth
c) three-fourth
2. How many children do not like to get wet in the rain?
a) half
b) one-fourth
c) three-fourth
If the number of children in the class is 28, then tell the number of children
- who like to get wet in the rain
- who do not like to get wet in the rain
Tea, Coffee or Milk
Some children were asked which of these they liked most–Tea, Coffee or Milk.
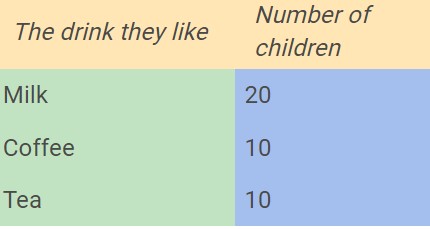
Total number of childrem Find out from the table:
- Children who like milk are 1/2 / 1/4 of the total children.
- Children who like coffee are 1/2 / 1/4 of the total children
Show the liking for Tea, Coffee or Milk in a Chapati Chart.