-
Data Handling
Introduction
You must have observed your teacher recording the attendance of students in your class everyday, or recording marks obtained by you after every test or examination. Similarly, you must have also seen a cricket score board. Two score boards have been illustrated here :
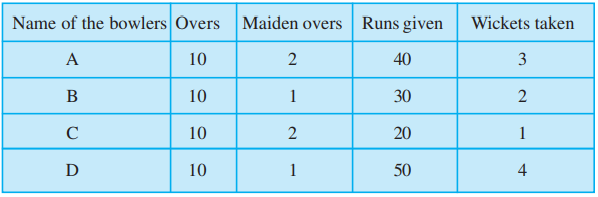
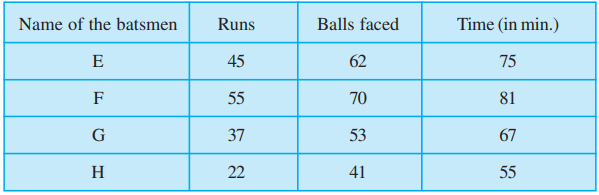
You know that in a game of cricket the information recorded is not simply about who won and who lost. In the score board, you will also find some equally important information about the game. For instance, you may find out the time taken and number of balls faced by the highest run-scorer.
Similarly, in your day to day life, you must have seen several kinds of tables consisting of numbers, figures, names etc.
These tables provide ‘Data’. A data is a collection of numbers gathered to give some information.
-
Data Handling
Recording Data
Let us take an example of a class which is preparing to go for a picnic. The teacher asked the students to give their choice of fruits out of banana, apple, orange or guava. Uma is asked to prepare the list. She prepared a list of all the children and wrote the choice of fruit against each name. This list would help the teacher to distribute fruits according to the choice.
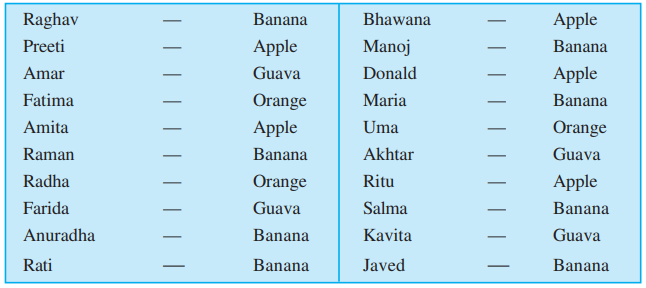
If the teacher wants to know the number of bananas required for the class, she has to read the names in the list one by one and count the total number of bananas required. To know the number of apples, guavas and oranges separately she has to repeat the same process for each of these fruits. How tedious and time consuming it is! It might become more tedious if the list has, say, 50 students.
 Banana
 So, Uma writes only the names of these fruits one by one like, banana, apple, guava, orange, apple, banana, orange, guava, banana, banana, apple, banana, apple, banana, orange, guava, apple, banana, guava, banana.
 Orange
Do you think this makes the teacher’s work easier? She still has to count the fruits in the list one by one as she did earlier.
 apple
appleSalma has another idea. She makes four squares on the floor. Every square is kept for fruit of one kind only. She asks the students to put one pebble in the square which matches their choices. i.e. a student opting for banana will put a pebble in the square marked for banana and so on.
 guava
guavaBy counting the pebbles in each square, Salma can quickly tell the number of each kind of fruit required. She can get the required information quickly by systematically placing the pebbles in different squares.
Try to perform this activity for 40 students and with names of any four fruits. Instead of pebbles you can also use bottle caps or some other tokens.
-
Data Handling
Organisation of Data
To get the same information which Salma got, Ronald needs only a pen and a paper. He does not need pebbles. He also does not ask students to come and place the pebbles. He prepares the following table.

Do you understand Ronald’s table?
What does one (✓) mark indicate?
Four students preferred guava. How many (✓) marks are there against guava?How many students were there in the class? Find all this information.
Discuss about these methods. Which is the best? Why? Which method is more useful when information from a much larger data is required?
Example 1 : A teacher wants to know the choice of food of each student as part of the mid-day meal programme. The teacher assigns the task of collecting this information to Maria. Maria does so using a paper and a pencil. After arranging the choices in a column, she puts against a choice of food one ( | ) mark for every student making that choice.
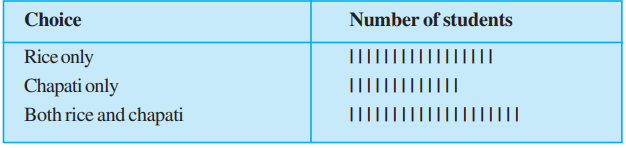
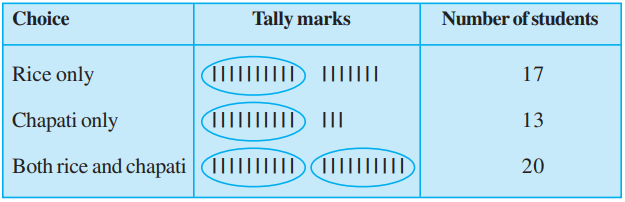
Umesh, after seeing the table suggested a better method to count the students. He asked Maria to organise the marks ( | ) in a group of ten as shown below :
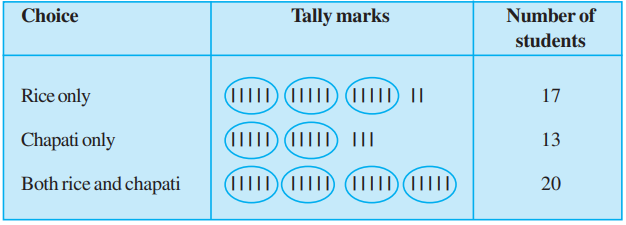
Rajan made it simpler by asking her to make groups of five instead of ten, as shown below :
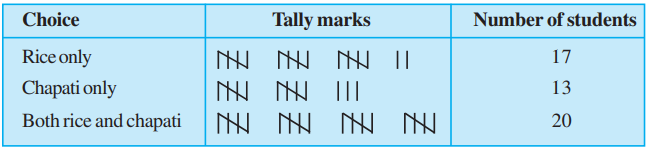
Teacher suggested that the fifth mark in a group of five marks should be used as a cross, as shown by ‘
 ’. These are tally marks. Thus, || shows the count to be five plus two (i.e. seven) and shows five plus five (i.e. ten).
 With this, the table looks like :
Example 2 : Ekta is asked to collect data for size of shoes of students in her Class VI. Her finding are recorded in the manner shown below :
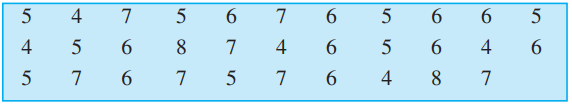
Javed wanted to know (i) the size of shoes worn by the maximum number of students. (ii) the size of shoes worn by the minimum number of students. Can you find this information?
Ekta prepared a table using tally marks.
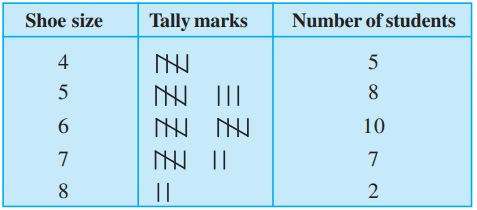
Now the questions asked earlier could be answered easily.
You may also do some such activity in your class using tally marks.
-
Data Handling
Pictograph
A cupboard has five compartments. In each compartment a row of books is arranged. The details are indicated in the adjoining table :
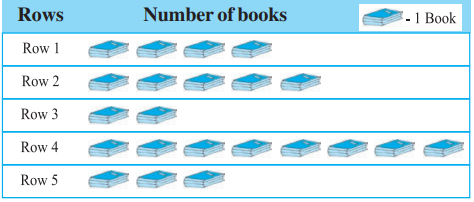
Which row has the greatest number of books? Which row has the least number of books? Is there any row which does not have books?
You can answer these questions by just studying the diagram. The picture visually helps you to understand the data. It is a pictograph.
A pictograph represents data through pictures of objects. It helps answer the questions on the data at a glance.
-
Data Handling
Interpretation of a Pictograph
Example 3 : The following pictograph shows the number of absentees in a class of 30 students during the previous week :
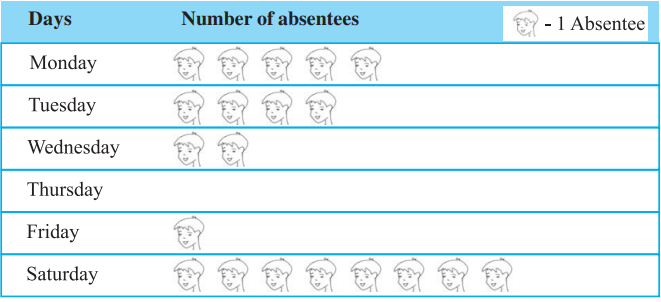
(a) On which day were the maximum number of students absent?
(b) Which day had full attendance?
(c) What was the total number of absentees in that week?
Solution : (a) Maximum absentees were on saturday. (There are 8 pictures in the row for saturday; on all other days, the number of pictures are less).
(b) Against thursday, there is no picture, i.e. no one is absent. Thus, on that day the class had full attendance.
(c) There are 20 pictures in all. So, the total number of absentees in that week was 20.
Example 4 : The colours of fridges preferred by people living in a locality are shown by the following pictograph :
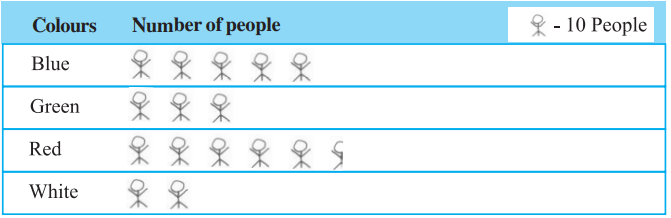
(a) Find the number of people preferring blue colour.
(b) How many people liked red colour?
Solution : (a) Blue colour is preferred by 50 people.
[
 = 10, so 5 pictures indicate 5 × 10 people].
 (b) Deciding the number of people liking red colour needs more care. For 5 complete pictures, we get 5 × 10 = 50 people.
For the last incomplete picture, we may roughly take it as 5.
So, number of people preferring red colour is nearly 55.
Think, discuss and write
In the above example, the number of people who like red colour was taken as 50 + 5. If your friend wishes to take it as 50 + 8, is it acceptable?
Example 5 : A survey was carried out on 30 students of class VI in a school. Data about the different modes of transport used by them to travel to school was displayed as pictograph.
What can you conclude from the pictograph?
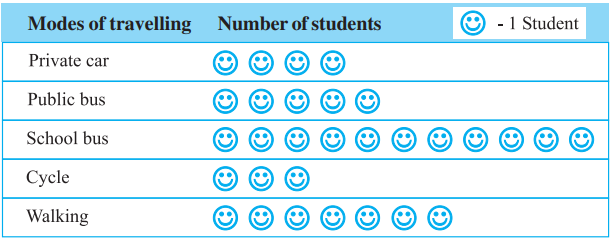
Solution : From the pictograph we find that: (a) The number of students coming by private car is 4.
(b) Maximum number of students use the school bus. This is the most popular way.
(c) Cycle is used by only three students.
(d) The number of students using the other modes can be similarly found.
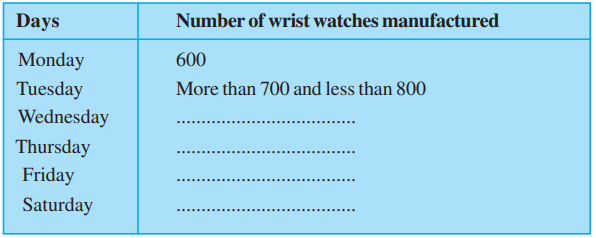
Example 6 : Following is the pictograph of the number of wrist watches manufactured by a factory in a particular week.
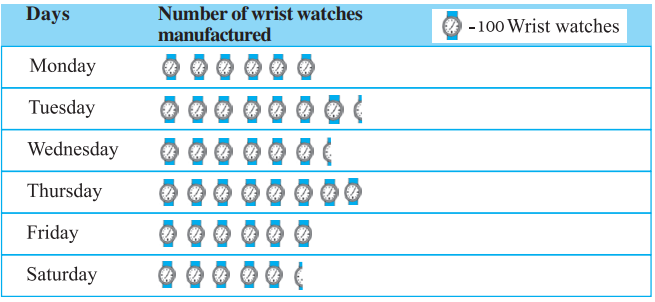
(a) On which day were the least number of wrist watches manufactured?
(b) On which day were the maximum number of wrist watches manufactured?
(c) Find out the approximate number of wrist watches manufactured in the particular week?
Solution : We can complete the following table and find the answers.